How Gantt Chart-Literate Are You? - article
Regular price
$0.00 USD
Sale
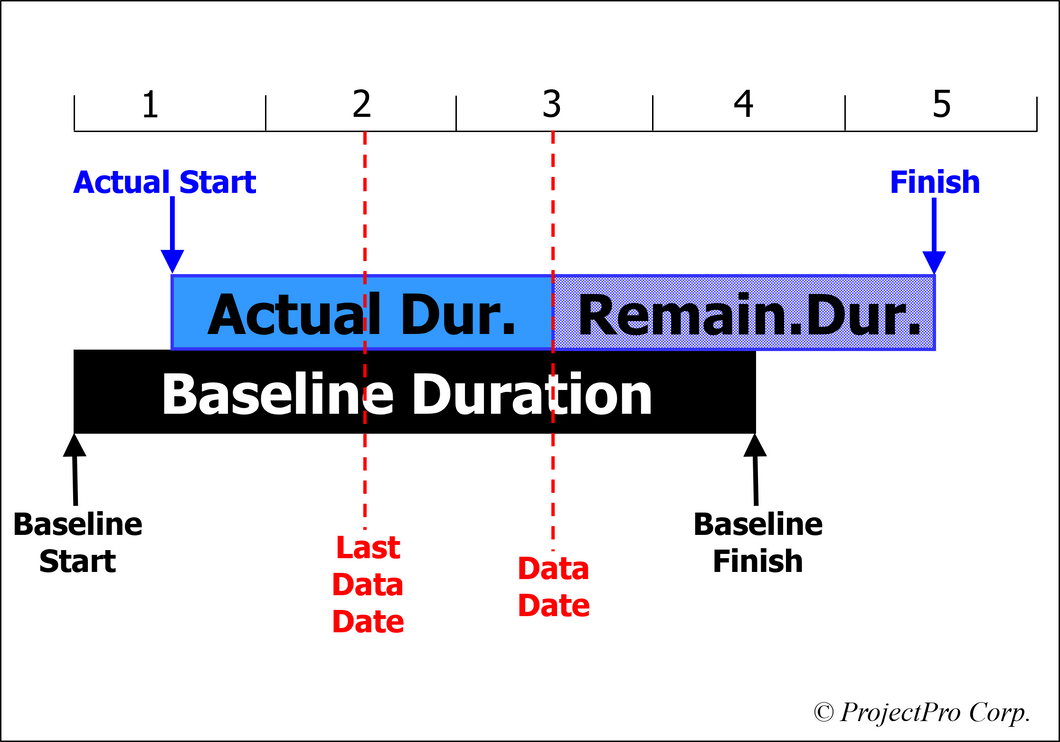
The Gantt Chart for a program or portfolio of projects is an important tool for managers and executives. The Gantt Chart is a picture that reveals information quickly. Since the Tracking Gantt Chart displays the original schedule next to the current schedule, it conveys the answers to several questions:
• Is the project schedule up-to-date?
If the progress runs up to the status date (data date), the schedule is up-to-date.
• Did the project start on time?
You compare the Start date of the project to its Baseline Start date.
• Is it progressing according to schedule or will it extend?
You compare the Duration of the project to the Baseline Duration.
By making these three analyses routinely, program managers can stay on top of their subprojects easily. Portfolio managers can track the projects in their portfolio.
